Three weeks ago I stood in front of the 60 attendees of the STAMPS course and asked, “How many of you are currently working with shotgun metagenomes?” Ten to fifteen people raised their hands. In contrast, almost all had their hands in the air when I asked how many were expecting to work with shotgun metagenomes sometime during the next year. People who come to the Marine Biological Laboratory as participants of the STAMPS course are probably representative of students and post-docs elsewhere who study microbes: metagenomics is gaining more and more traction, and more and more researchers feel that it may benefit them to take the ‘next step’ and start thinking beyond marker genes in their research questions.
Despite the excitement, I can tell based on my personal experience that there is nothing really friendly about working with metagenomes. I have enjoyed the world of marker genes while I was getting acquainted with microbial ecology thanks to the well-studied primers, well-put-together databases, and the overall know-how of pitfalls and opportunities regarding the marker gene workflow. However, I quickly realized that the transition from marker genes to metagenomes was not quite the ‘natural next step’ when I was staring at the first metagenomic dataset that came on my way sometime last year. To make things a bit worse, the switch is especially tough if someone believes that annotating their short reads is not going to be enough to go after questions they care.
One of the most exciting opportunities metagenomics offer is the ability to gain insight into the ‘genomic context’ of organisms that are very hard to cultivate. Indeed one can learn a lot about the presence-absence, or the relative proportions of genes across samples by simply annotating short reads. However, understanding the organization of genes and structural changes across genomes provides a much wider window into the microbial lifestyles and evolution. That being said, generating contigs from the metagenomic short reads is not an easy problem to solve as many factors affect the assembly performance.
Today our success with the assembly-based metagenomic workflow is still very environment-specific. While the fact that you usually don’t know what you did not amplify from your samples using a set of ‘universal’ bacterial primers can give you some comfort in marker gene-based studies, the bliss quickly vanishes with metagenomics as the portion of your data that is not represented in your assembly is usually painfully clear. Yes, the assembly-based workflow is challenging, and not always happy, but things are moving forward pretty rapidly to be too pessimistic about the future: increasing read lengths (Sharon et al. 2015), novel experimental approaches (Delmont et al. 2015), advances in computational tools (Brown et al. 2012), improvements in assembly algorithms and pipelines (Boisvert et al. 2012; Peng et al. 2012; Treangen et al. 2013; Iqbal et al. 2013), human-guided (Albertsen et al. 2013; Sharon et al. 2013; Laczny et al. 2015) and automatic (Alneberg et al. 2014; Kang et al. 2015) genome binning approaches, as well as comprehensive assessment tools for draft genomes (Parks et al. 2015) continue to make the assembly-based metagenomic workflow more and more accessible.
All these promising advances aside, there are still large gaps in our bioinformatics toolkit, especially if you are looking for things such as,
- Interactive environments to perform in-depth, multilayered analyses of metagenomic data,
- Ability to share and communicate findings — not only as static images and text, but also as interactive instances of your analyses through which your peers can investigate your findings,
- Or easy ways to combine datasets of different nature (i.e., putting metagenomic and metatranscriptomic data into one intuitive display).
In an attempt to address some of these challenges we developed a new software platform. Anvi’o is an open-source platform with more than 25,000 lines of code predominantly written in Python, Javascript, and C, and aspires to be a community-driven effort.
Anvi’o has an interactive interface that helps researchers to get their hands dirty with their datasets. The interface can visualize the organization of contigs, and their distribution across samples at the same time, while allowing the user to group contigs into genome bins, or refine genome bins identified by any automatic binning approach.
It is not very easy to communicate the perks of the interactive interface and the visualization strategy anvi’o follows without an example, so here is one: our re-analysis of the infant gut dataset by Sharon et al. (2013). In their study, Sharon et al. have used emergent self-organizing maps (ESOMs) to identify genome bins by utilizing sequence composition and differential coverage for initial binning. Following are the two figures from their study; the first one shows the ESOM bins for contigs, and the second one shows the distribution of those bins across samples (Figures 1 and 2 in the original publication):


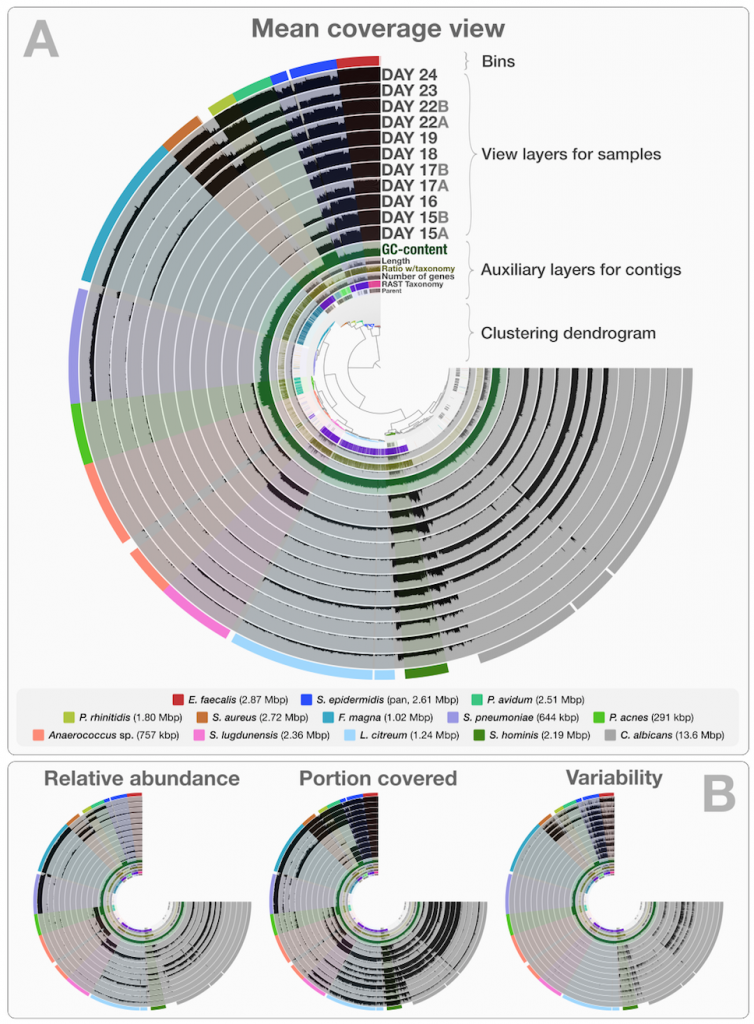
After identifying these genomes, Sharon et al. continues with a very meticulous and comprehensive analysis of these genomes, and throughout the paper Jill Banfield’s group demonstrates the power of metagenomics once again. I also think the figures above facilitate a reasonable way to display the data of this nature, however, this concept lacks two potentially very helpful pieces of information. First, the organization of contigs and the distribution of each contig across samples are not connected visually, therefore it is not easy to make sense of what defines the distances of those dots on the ESOM organization intuitively. Second, one cannot really examine in detail or display different properties of each contig with these 2D plots. For instance, the ESOM organization relies on sequence composition and differential coverage of contigs, but what if you were curious to display the number of SNPs identified in each contig? Would you have seen a coherent distribution of SNPs in a given genome bin? What if you would like to overlay taxonomy, or the number of genes identified in each contig, or the ratio of coding versus non-coding region for each contig, and see all these in one figure to improve your binning or quality assurance? In my opinion tinkering with these aspects of metagenomic data should not require one to write multiple ad hoc scripts, but it should be as easy as a couple of mouse clicks, zooming in an out, and selecting things from various combo boxes. One of our goals with anvi’o was to make sure that the researcher has access to all these information and potentially more in one display. Here is the same dataset, and anvi’o’s take on it:
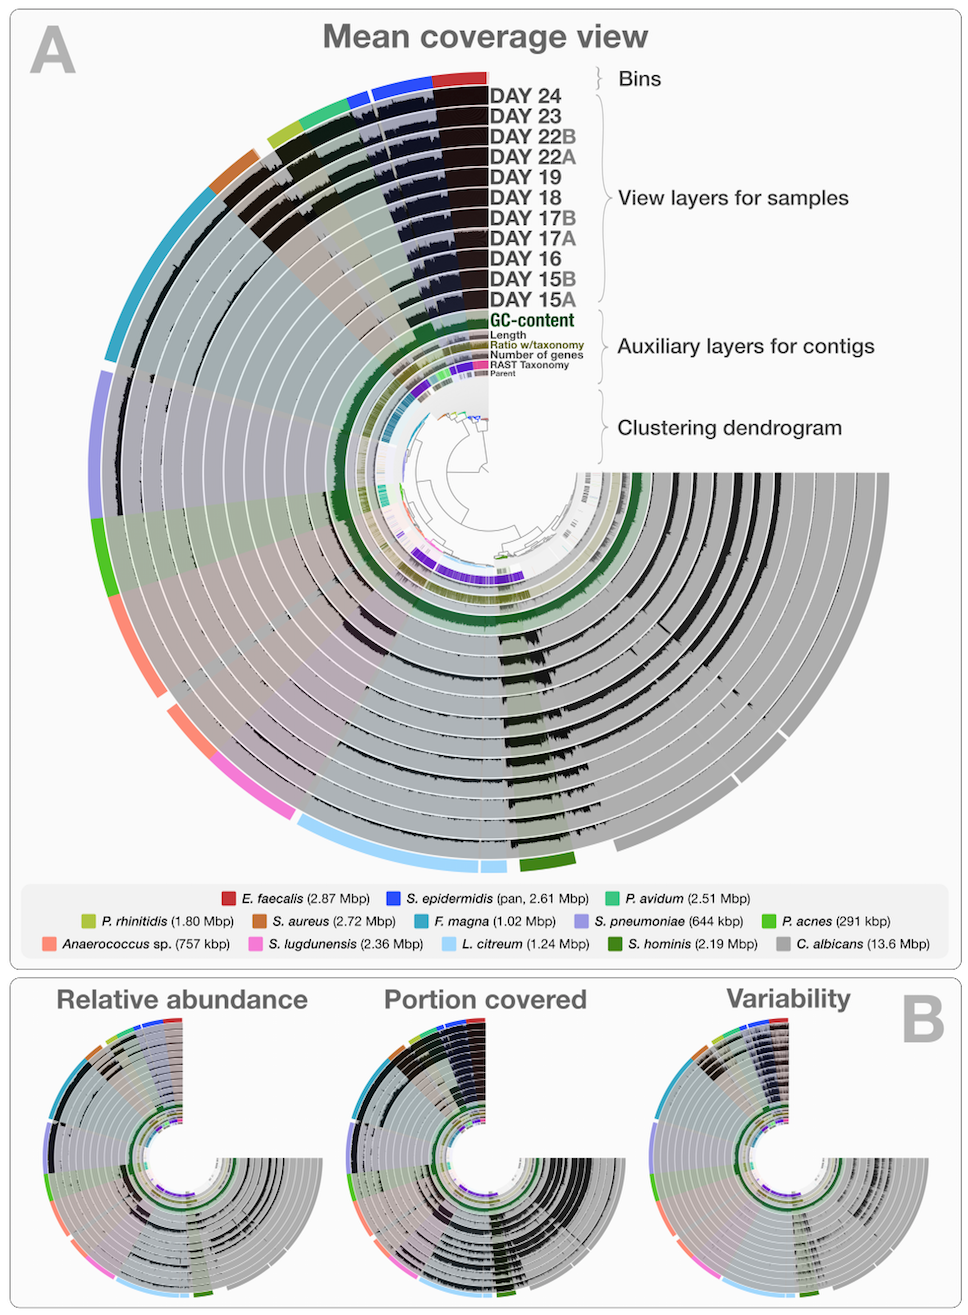
This is a static image from anvi’o’s interactive interface for the infant gut dataset with genome bins. The hierarchical clustering of contigs in the center is based on TNF and differential coverage of contigs. Sample-independent information for each contig is displayed in auxiliary layers (i.e., the RAST taxonomy, the number of genes, the GC-content). Then there are the view layers that show a single property of a given contig across samples. That single property is “mean coverage” for Panel A, but others are exemplified in Panel B: “relative abundance”, “portion covered”, and “variability” of splits among samples. All it takes to switch between those are a couple of mouse clicks.
Although this is a static image, you can in fact play with it by visiting this web page, where an instance of anvi’o is ready to display this dataset: http://anvio.org/infant.
Once you are there, you can click the Draw button, do some binning, get real-time feedback for your bins with respect to multiple bacterial single-copy gene collections, inspect your contigs to see SNP patterns, or the stability of coverage of a given contig across samples. You can also change the clustering of contigs, switch to different views, or load our previous selections of genome bins by simply clicking “Load Bin Collection”, or view the anvi’o summary of our selection of bins from this dataset.
Anvi’o can be used for more than metagenomes: it can link metagenomes with metatranscriptomes, allow you to work with your cultivar genomes, characterize SNPs across samples, or even benchmark multiple mapping software. We are excited to explore new ways to utilize it.
If you would like to give anvi’o a try, you can install it via conventional ways, or you can obtain a running instance of it on your Linux box in seconds as a Docker image, or use our Mac installer. Anvi’o has a user manual, and we are looking forward to expand it to address your needs.
References
Albertsen M, Hugenholtz P, Skarshewski A, Nielsen KL, Tyson GW, Nielsen PH. (2013). Genome sequences of rare, uncultured bacteria obtained by differential coverage binning of multiple metagenomes. Nat. Biotechnol. 31:533—8.
Alneberg J, Bjarnason BS, de Bruijn I, Schirmer M, Quick J, Ijaz UZ, et al. (2014). Binning metagenomic contigs by coverage and composition. Nat. Methods 11:1144—1146.
Boisvert S, Raymond F, Godzaridis E, Laviolette F, Corbeil J. (2012). Ray Meta: scalable de novo metagenome assembly and profiling. Genome Biol. 13:R122.
Brown CT, Howe A, Zhang Q, Pyrkosz AB, Brom TH. (2012). A Reference-Free Algorithm for Computational Normalization of Shotgun Sequencing Data. (arXiv preprint).
Delmont TO, Eren AM, Maccario L, Prestat E, Esen ÖC, Pelletier E, et al. (2015). Reconstructing rare soil microbial genomes using in situ enrichments and metagenomics. Front. Microbiol. 6:358.
Iqbal Z, Turner I, McVean G. (2013). High-throughput microbial population genomics using the Cortex variation assembler. Bioinformatics 29:275—6.
Kang DD, Froula J, Egan R, Wang Z. (2015). MetaBAT, an efficient tool for accurately reconstructing single genomes from complex microbial communities. PeerJ 3:e1165.
Laczny CC, Sternal T, Plugaru V, Gawron P, Atashpendar A, Margossian HH, et al. (2015). VizBin – an application for reference-independent visualization and human-augmented binning of metagenomic data. Microbiome 3:1.
Parks DH, Imelfort M, Skennerton CT, Hugenholtz P, Tyson GW. (2015). CheckM: assessing the quality of microbial genomes recovered from isolates, single cells, and metagenomes. Genome Res. 25:1043—55.
Peng Y, Leung HCM, Yiu SM, Chin FYL. (2012). IDBA-UD: a de novo assembler for single-cell and metagenomic sequencing data with highly uneven depth. Bioinformatics 28:1420—8.
Sharon I, Kertesz M, Hug LA, Pushkarev D, Blauwkamp TA, Castelle CJ, et al. (2015). Accurate, multi-kb reads resolve complex populations and detect rare microorganisms. Genome Res. gr.183012.114.
Sharon I, Morowitz MJ, Thomas BC, Costello EK, Relman DA, Banfield JF. (2013). Time series community genomics analysis reveals rapid shifts in bacterial species, strains, and phage during infant gut colonization. Genome Res. 23:111—20.
Treangen TJ, Koren S, Sommer DD, Liu B, Astrovskaya I, Ondov B, et al. (2013). MetAMOS: a modular and open source metagenomic assembly and analysis pipeline. Genome Biol. 14:R2.