I’ve been remotely following the Sloan MBE meeting discussions (happening in Boulder, CO this week), and yesterday there was a lot of Twitter discussion focused on data visualization tools. How do we make sense of the millions of DNA sequences we generate from microbial ecology projects in the Built Environment?
I thought I’d use this opportunity to highlight a project I’ve been leading in the Eisen Lab: Phinch (http://phinch.org, funded by the Alfred P. Sloan foundation), an interactive, exploratory data visualization framework for environmental sequence data. We’re developing this tool in collaboration with Pitch Interactive (a data visualization studio in Berkeley, CA) and the goal is to produce a high functionality framework with good graphic design aesthetics.
Phinch is open source software (you can view our code on Github) for carrying out downstream data analysis in your web browser (Google Chrome). The idea is to take your QIIME outputs – .biom OTU table files with taxonomy and embedded metadata – directly into a data visualization framework for assessment. Manipulate and explore your data, and then directly export vector images to include in your publications. Or use a “share” feature to save your visual modifications and send it off to collaborators (for them to view and explore too).
Our test data on http://phinch.org comes from microBEnet’s undergraduate research project – with one click, explore our microbes or upload your own file!
Some Phinch screenshots below:


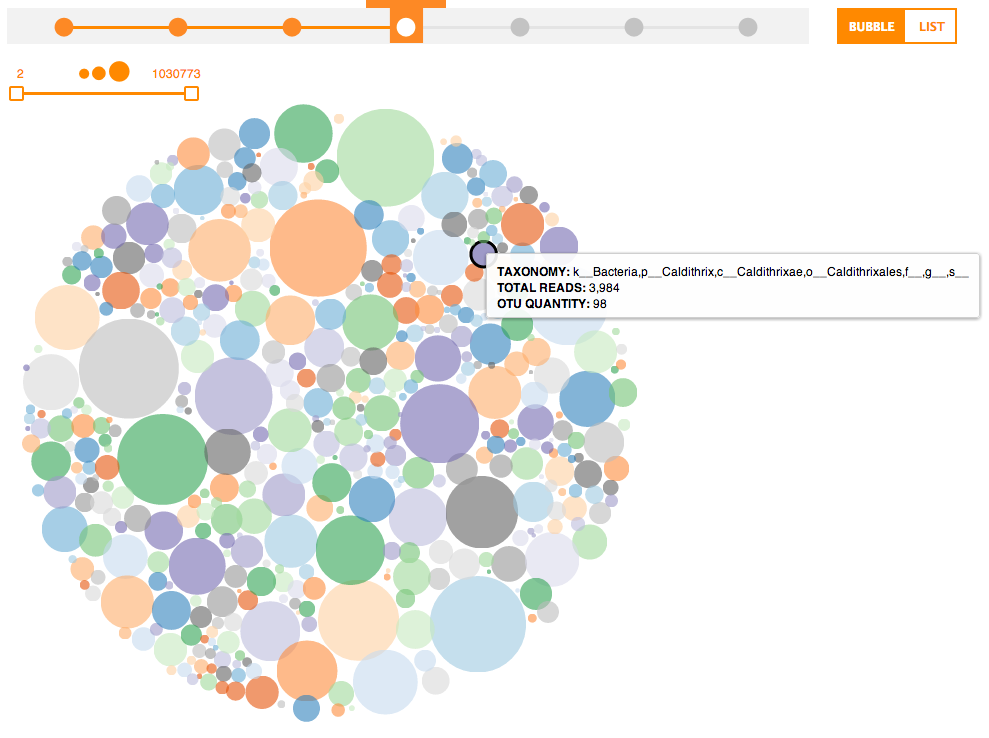
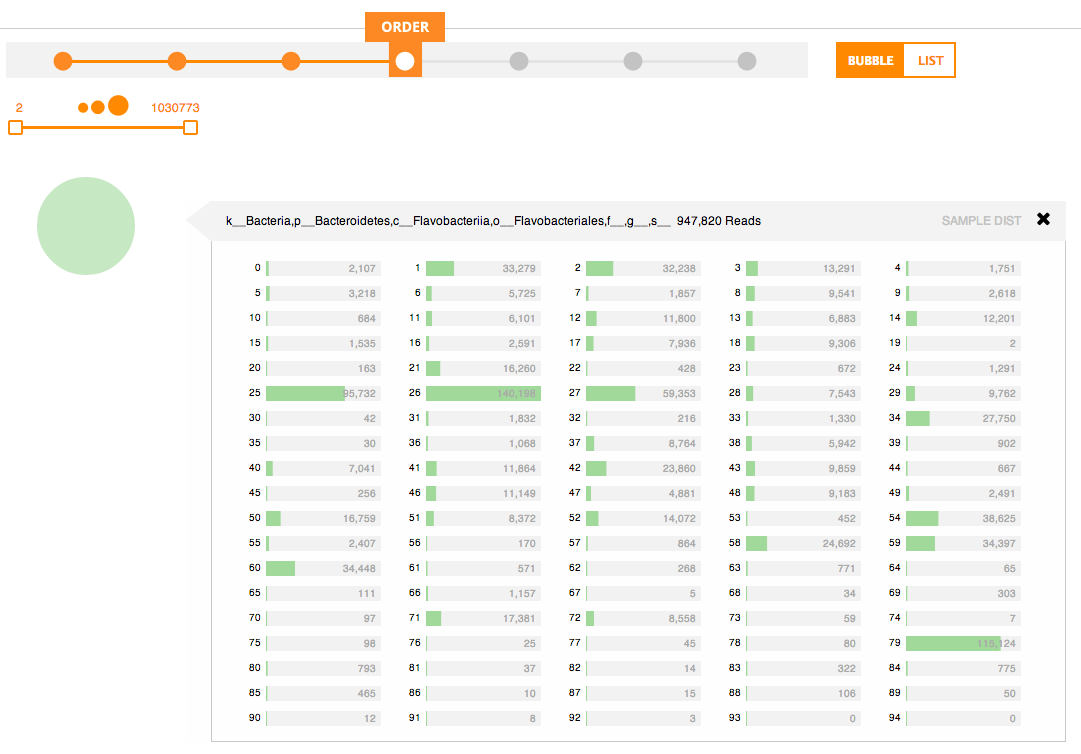
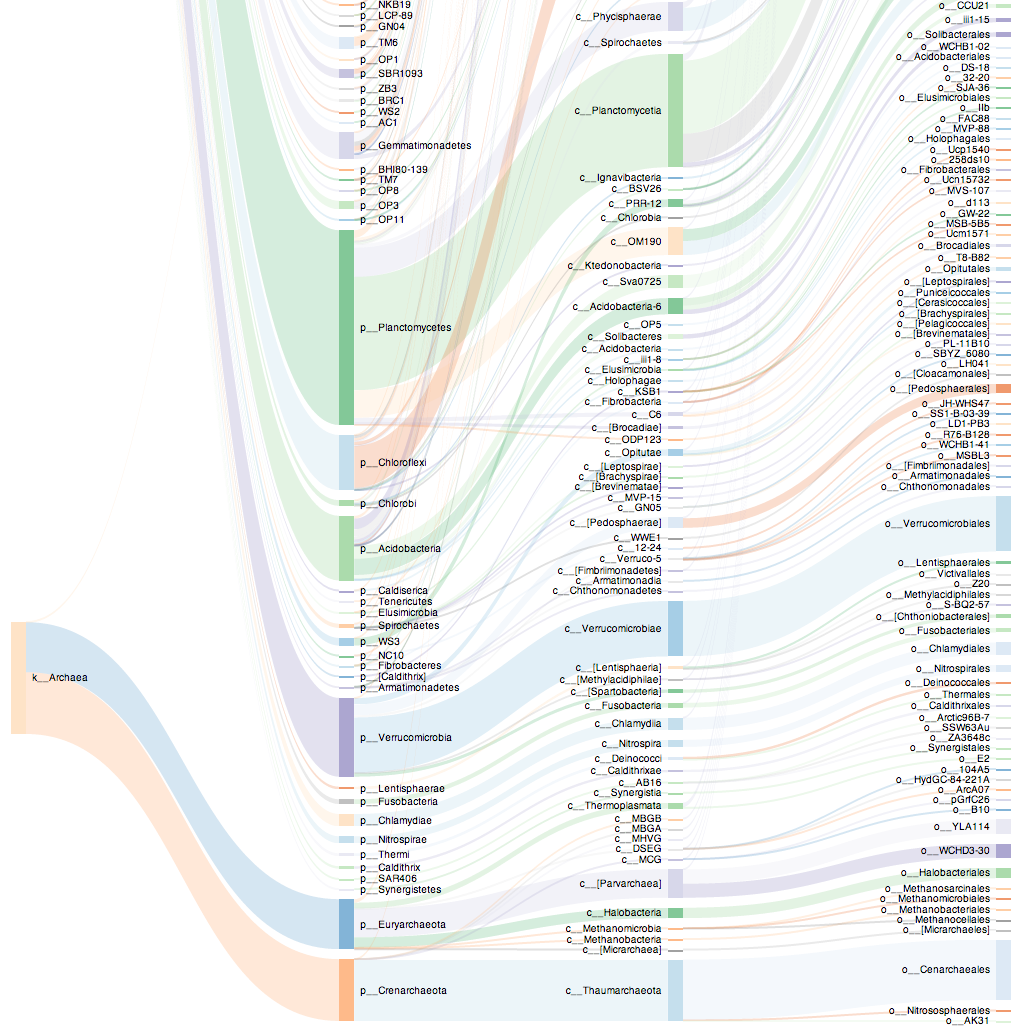
Nifty!