WTH is ILR?
by Alex Washburne & Jamie Morton
Jamie and I have penned a popularization of the isometric log-ratio transform with the intention to allow non-mathematicians to understand the intuition behind what it is, why we use it, and how different methods use the same tool in different ways. The full write-up is available here, but the sections below give you the big-picture:
Several recent papers we’ve been involved in have utilized the isometric log-ratio (ILR) transform to analyze microbiome datasets. The papers and their software packages range from a phylogenetic transform (PhILR), a phylogenetic version of factor analysis (phylofactor), and using balance trees for hierarchical clustering (gneiss). In this post, we will demystify the ILR transform to help readers disentangle the literature that uses this transform in different ways to perform different analyses.
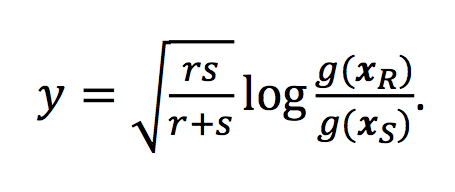
The elevator speech is that the ILR transform is a reasonable and convenient way of measuring the difference between two groups of species and the three methods above, which all use the ILR transform to measure differences, differ in which groups of species they measure the difference between.
… <all the details about the ILR> …
… PhILR, phylofactor and gneiss differ in which two groups to differentiate and how to interpret the resulting ILR coordinates. PhILR and phylofactor both require the phylogenetic tree as a scaffolding for coordinates. PhILR differentiates sister clades, and so there is only one PhILR transform for a given tree, there can be no polytomies in the tree, and coordinates correspond to differences between sister clades weighted by the branch length separating the sister clades. Phylofactor differentiates clades along edges in the tree according to which edge is “coolest”, so there are many phylofactorizations for a given tree depending on the data and how you define “cool”, and coordinates are interpreted as inferences on edges along which an important, functional ecological trait may have arisen. Gneiss differentiates groups of OTUs in more general hierarchical clustering schemes to investigate partitions that cannot be explained by phylogeny (for a fluent user, the machinery in Gneiss could be used to perform phylogenetically-informed hierarchical clustering – stay tuned).
The full write-up contains some whiskey-laced mathematical fun that can help you understand isometric log-ratios enough to build your own ILR transform. Check it out here!

Thanks Alex and Jamie for your insights! The PhILR method is interesting as it incorporates the compositional nature of microbiome count data into the analysis, makes use of generalized linear models to compare taxa (glmnet), and has the potential to reshape our current analysis pipelines in productive ways. A question that I can anticipate from many (as someone who works in applied microbiome research), would be to justify the use of more complex methods to alter existing analysis pipelines, rather than just stick with DESeq, for example, to determine differences between groups.
For example, if you are comparing two groups (e.g., healthy vs treatment), what are the major advantages to looking at the compositional nature of the data using balances, rather than just using classical differential abundance of count data? Is this method better when the differences are perhaps more subtle (e.g., comparing minor alterations in lifestyle), vs a more dramatic expected difference (e.g., taking an antibiotic)? After reading the paper (https://www.ncbi.nlm.nih.gov/pmc/articles/PMC5328592/), while I am satisfied that I understand everything as best I can, I still did not walk away with a full appreciation of how to explain this to, for instance, my boss.
Of course getting closer to the truth is valuable, and as someone who appreciates the role that math plays in the development of computational biology, the truth is a good explanation. But of course, people are not necessarily interested in the truth–they are interested in nice stories. So what are the best ways to convince my boss that I’m not a biologist-gone-crazy for taking a method like this and applying it to my data when existing methods get most of the job done?